The City I See

The City I See

The subject of the city as a complex ‘system of systems’ is widely acknowledged and has been studied for decades.  One of the earliest ideas on the complexity of the city was articulated in the early 1960’s by Jane Jacobs [1] and defines the challenges for urban science to this day [2].  Cities are becoming increasingly complex, especially due to numerous challenges experienced at a global scale, such as the Covid pandemic and climate change.    

The intention of the following piece is to both revisit concepts and offer ideas on how we apply different approaches to the city to enhance urban inclusivity, sustainability and resilience. It is worth noting that my intention is for the brevity of the contemplated subjects to offer opportunity for future expansion and not to create the impression of superficial consideration.  

The Natural City

Nature-based solutions (NBS) are widely defined as actions or solutions that are inspired by nature to address societal challenges, such as climate change, food and water security or natural disasters [3,4].  The UN Environment Programme (UNEP) report on nature-based solutions highlights how these solutions can assist cities in dealing with fundamental environmental challenges [5].  An interesting study by researchers at the Urban Systems Lab (The New School, New York) looked at combining blue, green and grey infrastructure for disaster risk reduction and climate change adaptation in the urban context [6].  The International Institute for Environment and Development (iied) produced a very informative paper on examples of how nature-based solutions are applied globally [7].

Urban level NBS Source: World Bank/GFDRR, 2021; designs by Felixx Landscape Architects and Planners

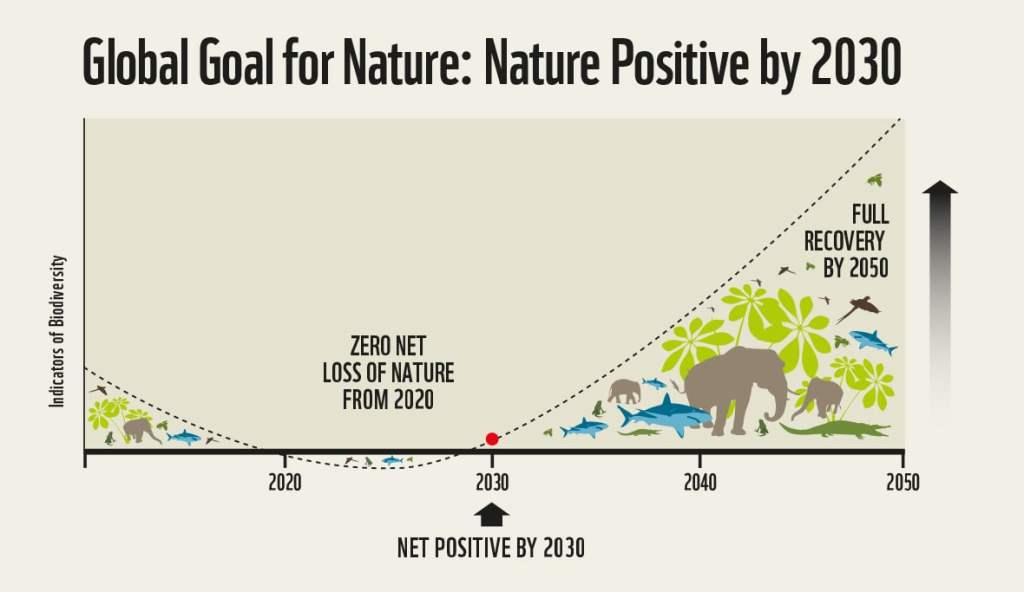
Nature Positive is a concept that is increasingly considered and defined by the process of not only stopping, but also reversing nature loss by “increasing the health, abundance, diversity and resilience of species, populations and ecosystems” [8] to ensure a visible and measurable path of recovery.  The Interdisciplinary Centre for Conservation Science (ICCS) at the University of Oxford [9] emphasizes that the need for quantitatively demonstrated overall net gain is much more important than merely the idea of reversing nature loss and moving towards recovery.  The Cambridge Institute for Sustainability Leadership also developed a Nature-Positive Hub that is committed to the subject. A dynamic to consider, especially in the urban context, is the continuous (negative) impact human activities will have on nature and the appropriate compensation required. 

Nature Positive Goal – © naturepositive.org

The Biological City

Biomimicry is one of the most fascinating concepts for solving complex problems and simply refers to nature-inspired innovation.  Janine Benyus from Biomimicry 3.8 recently stated that it is essential that we are reminded that a sustainable world already exists in nature.  Hence, biomimicry is a process by which the natural world is ‘consulted for advice’ on design, engineering and social innovation in the built environment.  Leonardo Da Vinci studied the behaviour of birds to design the first flying machines.    

The following are some examples of biomimicry in urban development:

  • Architects are inspired to develop more efficient buildings by the manner in which termites cool their mounds by drilling holes [10]
  • The enhancement of road network planning can be inspired by studying physarum polycephalum (slime mould) creating optimized networks for transferring nutrients [11]
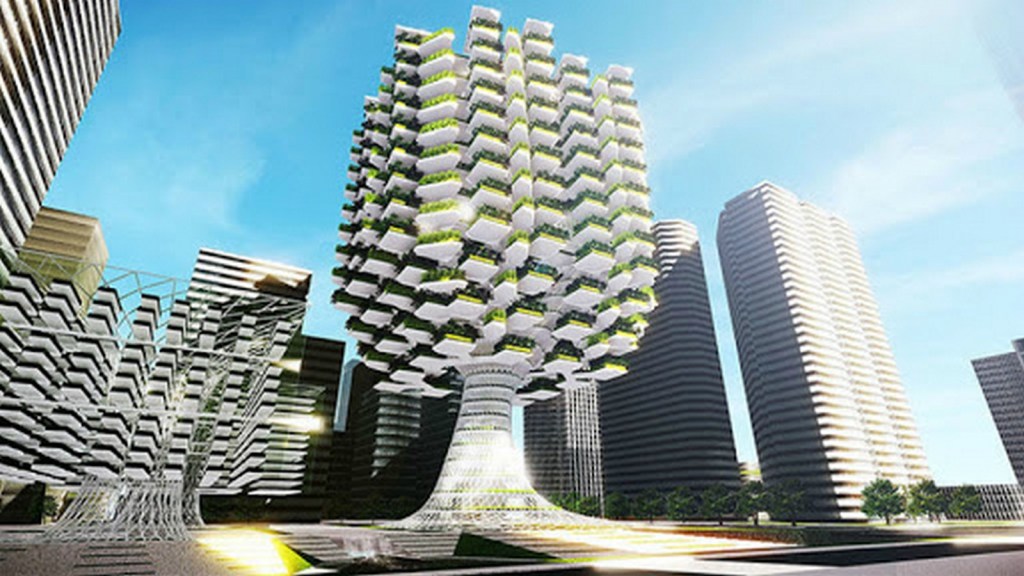
  • Vegetation building façades not only combat carbon, but also attracts birds and insects [12]

How could we identify more examples from nature to develop more resilient urban environments, such as honeycomb-inspired earthquake-resistant buildings?  How could we enhance our approach to circular economy by transforming the linear systems of energy still used in the built environment to follow the example of closed-loop systems that ecosystems use? 

Biomimicry in urban design ©themodernape.com

How could we harness the biological concept of homeostasis in the urban context?  What potential does homeostatic processes offer for the self-regulation of urban systems and subsequent maintenance of stability?  Researchers from the Architectural Association School of Architecture in London highlighted that biological principles of homeostasis have the potential to be applied to generative design processes, resulting in architectural morphologies that are better suited for the environmental context [13].  Considering urban space, how could homeostatic principles be applied to enhance the study of morphology?  A good example is a recent PhD research study at the Open University, developing a computational evolutionary model to generate urban morphologies with embedded homeostatic behaviour [14].

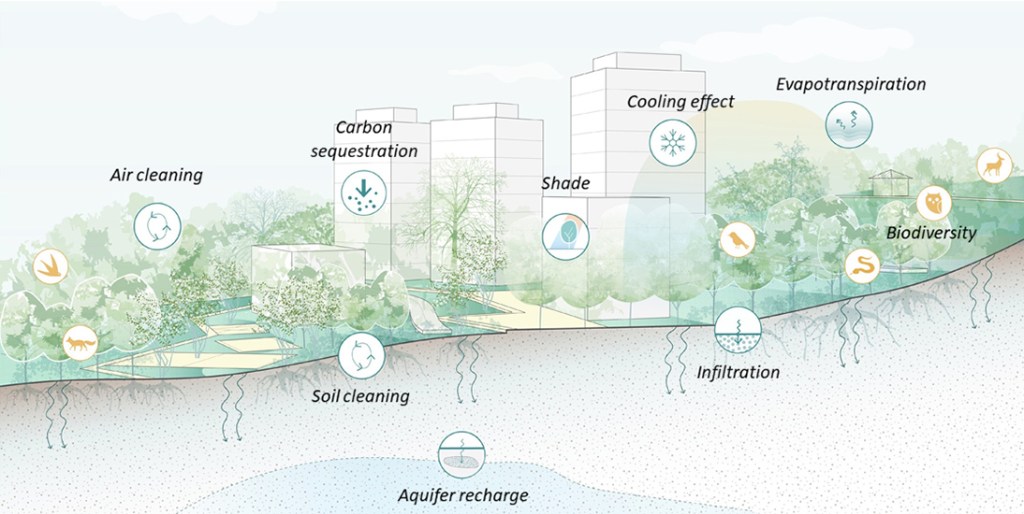
Following on from the above, urban metabolism considers the city as if it is a living biological system.  It provides a framework by which the inflows, outflows and accumulation of resources in a city could be quantified [15].  Although Karl Marx and Friederich Engels were the first individuals to refer to processes that are known today as urban metabolism, it was from a sociological perspective [16].  Patrick Geddes was the first scientist to describe urban metabolism by depicting energy and material flow within the urban context [17,18].  An opportunity was identified where the integration of spatially explicit urban metabolism data in urban planning can enhance resource-efficient development and also the management of open space.  Researchers formulated a strategy for investigating how the use of GIS data can improve the application of metabolic studies in urban planning and open space management.  They performed a GIS-based urban metabolism assessment of Mexico City (at city scale) by including data on vulnerable communities, communal land and indigenous areas [19]. The image below reflects the urban metabolism plan for Brussels, co-led by Brussels Environment, Impulse, Innoviris and Bruxelles Propreté.    

The Urban Metabolism of Brussels, Belgium © Ecocity Builders

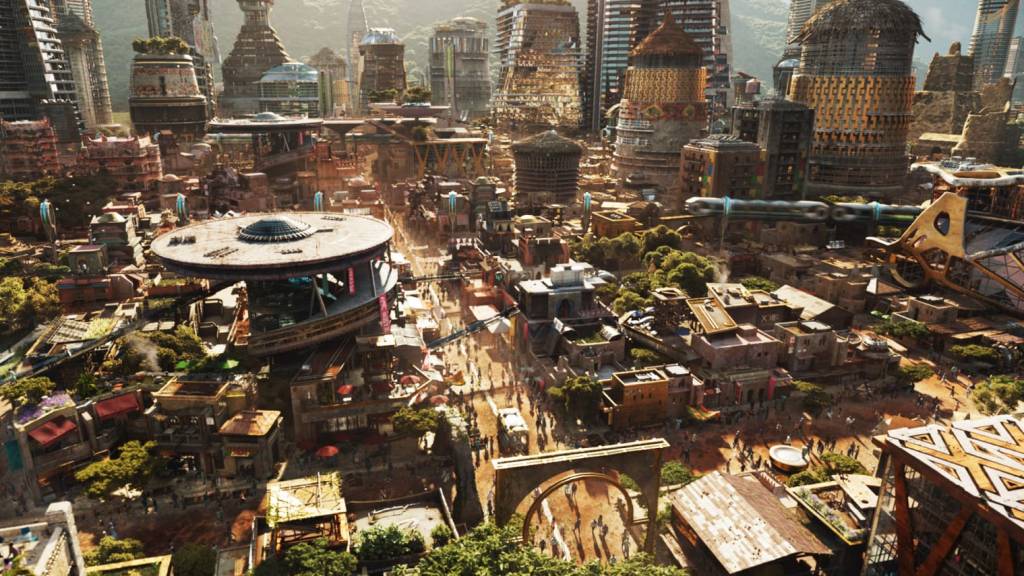
Symbiosis refers to the living together of two dissimilar organisms in intimate association or cooperative relationship between two individuals or groups [20].  Whether we call it that or not, it is a concept studied on a frequent basis in the urban context – the relationship between motor vehicles and pedestrians or cyclists, the dynamics between different cultural groups in a city etc.  There is also the potential for cities to address environmental challenges through the application of urban metabolism – the transformation of linear relationships between consumption and waste to a looped system when outputs are returned as inputs, such as wastewater recycling [21].  How could symbiosis also be applied to the relationship between urban inhabitants and nature, promoting regenerative development?  I believe that a truly symbiotic city would not only enhance its natural aspects, but also a sustainable urban economy and quality of life.  The fictional city of Birnin Zana in Wakanda (Black Panther) comes to mind.  Various subjects provided for continuous (and sometimes heated) discussion, but for me personally the fusion of nature and technology was quite remarkable and I also appreciated the walkability of the city. 

City of Birnin Zana, Wakanda © MARVEL

The Scientific City

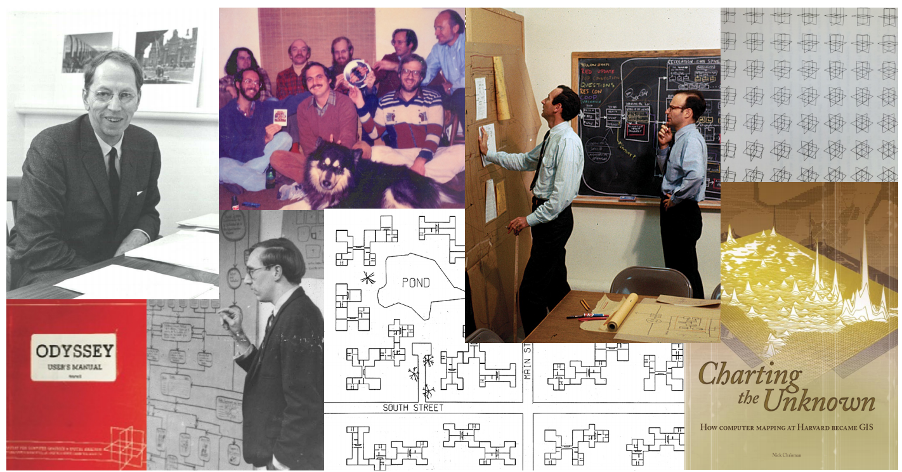
The interdisciplinary field of urban science has grown in popularity in recent years and contributes theoretical and practical knowledge to understanding and solving urban problems.  In the book Urban Informatics, Prof. Mike Batty states that urban science “deals with generic theories of how cities are structured and how they grow and evolve in time, how they change qualitatively with respect to growth, and how their populations organize themselves in space” [22].  The problems that urban planning needs to address are often revealed by these features.  Conventional scientific method laid the foundation for the development of the most efficient tools and techniques in urban informatics.  Prof. Batty points out that urban science, like any other science, articulates the relationships that define city components by using quantitative methodologies, which are validated by observing actual cities.   

In his recent book [2], Luis Bettencourt argues that until recently our understanding of urban processes was very limited and highlights the importance of a deeper and systematic scientific engagement with cities. 

“The power of scientific knowledge is not in its ability to solve specific problems but rather in that it forces us to change our intuitive frameworks and adopt new perspectives from which new transformative solutions become not only possible but often relatively easy.”
Luis Bettencourt, Introduction to urban science: evidence and theory of cities as complex systems.

The Technological City

Key to the growth of Smart Cities is the continuous development of technologies such as the Internet of Things (IoT), Artificial Intelligence and Geospatial Technologies.  However, it is essential that the enhanced systematic and economic functionality of the smart city also considers two interrelated subjects:  livability and inclusivity.

McKinsey’s Global Institute assessed how smart-city applications could affect the following quality of life dimensions [23]:

  • Improvement of Public Safety:  data-driven policing, while protecting civil liberties
  • Faster and More Efficient Commuting:  digital signage and mobile apps providing real-time information
  • Better Public Health:  digital applications to monitor, help prevent and treat chronic conditions
  • More Sustainable Environment:  water consumption tracking applications and building-automation systems
  • Enhancement of social connectedness:  digital channels and platforms to communicate with local official or agencies

Tremendous opportunity also exists in the application of geospatial technologies and analytics to gain insights relating to the five subjects above.  Public safety can be enhanced through mapping crime hotspots and potential patterns, for example.  Traffic simulation and congestion visualization would aid commuter decision-making.  Apart from monitoring applications, air quality mapping will aid decision-making in terms of public health.  Spatial visualization of sensor readings will provide insights into water and/or electricity consumption and related patterns.  The mapping of Twitter feeds (for example) could highlight problems in certain regions.  Furthermore, the application of urban simulation could study crowd movement in urban spaces and plan evacuation strategies or placement of policing.  When it comes to urban innovation, how could more global platforms such as Tomorrow.City for example be generated to target specific challenges? 

Twitter Language Map © Erica Fischer flickr

The degree to which a city is socio-economically inclusiveness is closely related of course to the general quality of life in that city.  How could technology be harnessed to promote inclusivity and address the ‘digital divide’, experienced especially in developing countries?  For example, how could digital wayfinding include additional information to the location of public transport nodes, such as affordable commercial entities or fruit market locations?  In Kolkata, India, postal codes were provided to more than 120 000 slum residents by a startup, helping them to obtain bank accounts, voting registration and document to access government services [24].  In London a joint venture between design studio Ustwo and the Royal London Society for Blind People is assisting the visually impaired navigate the city’s transportation network, using beacons to provide audio instructions via a smartphone application [25].       

The Social City

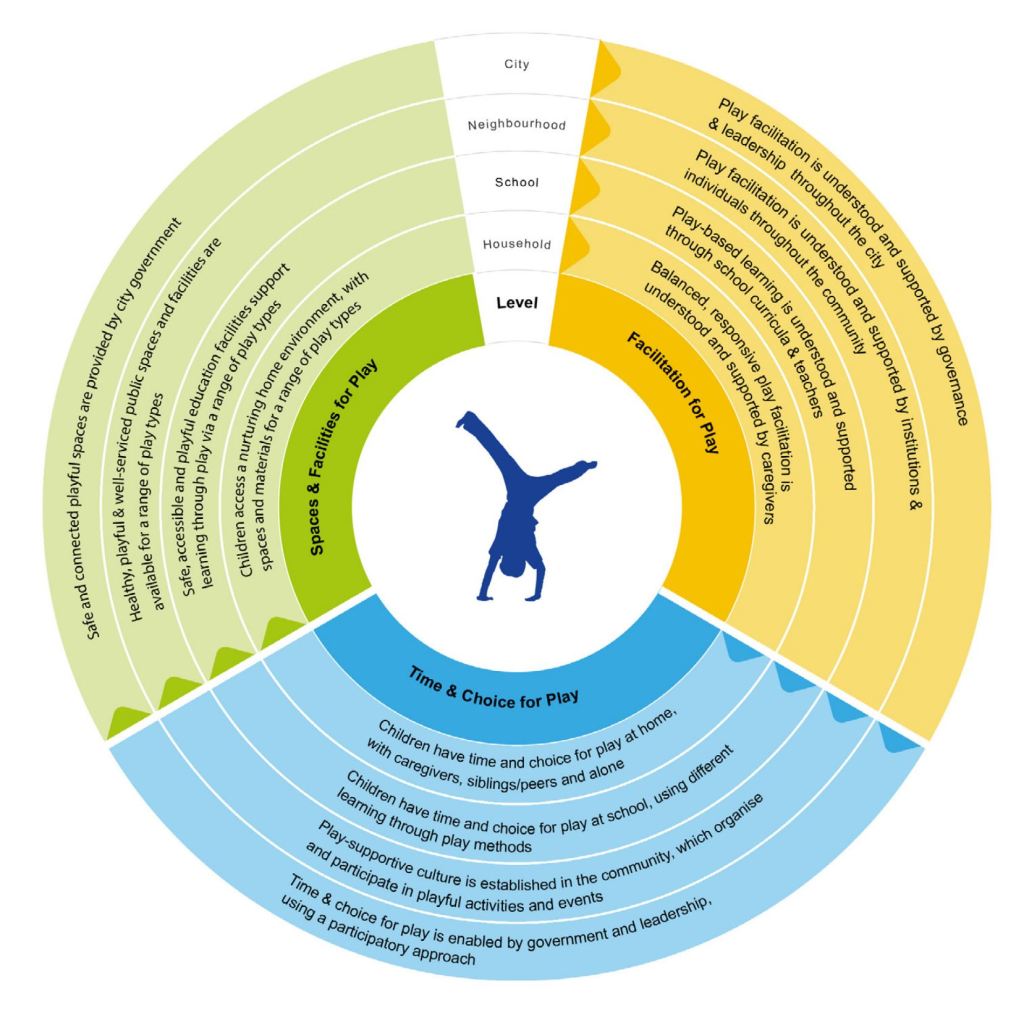
One of the most important characteristics of a sustainable city is the degree of social value it offers its inhabitants.  Beyond the important subjects of employment and housing, how could we instill a sense of belonging through place making and promote community development through social constructs?  Urban playgrounds not only enrich the lives of children (physically, mentally and socially), but also promotes interaction between parents and in doing so build a sense of community.  Arup and the LEGO Foundation developed the Urban Play Framework and Playful Cities Toolkit in partnership with the Real Play Coalition to provide a range of resources for understanding the complexities of play in the city and also to guide the design of play environments [26].

The Urban Play Framework © The LEGO Foundation and Arup

Finally, designing cities for mental wealth and wellbeing contributes immensely to the social value of urban space.  Restorative Cities is a fascinating book on the subject [27] and offers a robust scientific basis for the multidisciplinary field of urban design and planning for mental health.  Furthermore, it provides a framework for defining and integrating the components of a restorative city and offers related guidance.

“What is the city but the people?” 
William Shakespeare

Although this discussion categorizes subjects and consider them separately, it is quite evident that they are all related to each other and should also be addressed in that manner. This is by no means a comprehensive study on the complexities of the city, but rather an overview of interesting concepts that are and can be applied in the urban context to enhance our understanding of its processes.

References

[1]  Jacobs, J., 1961. The Death and Life of Great American Cities

[2]  Bettencourt, L.M.A., 2021. Introduction to urban science: evidence and theory of cities as complex systems

[3]  Cohen-Shacham, E., Walters, G., Janzen C, Maginnis, S. (2016) Nature-based solutions to address societal challenges. Gland, Switzerland

[4]  European Environment Agency (2016) Building resilient cities key to tackling effects of climate change. Copenhagen, Denmark

[5]  https://www.unep.org/resources/report/smart-sustainable-and-resilient-cities-power-nature-based-solutions

[6]  Depietri, Y. and McPhearson, T., 2017. Integrating the grey, green, and blue in cities: Nature-based solutions for climate change adaptation and risk reduction. In Nature-based solutions to climate change Adaptation in urban areas (pp. 91-109). Springer, Cham

[7]  https://www.iied.org/sites/default/files/pdfs/2021-09/20451g.pdf

[8] https://www.naturepositive.org/

[9]  https://www.iccs.org.uk/blog/everyones-going-nature-positive-what-does-it-mean

[10] https://carnegiemnh.org/biomimicry-is-real-world-inspiration/

[11] https://architecturemps.com/wp-content/uploads/2013/09/mc_london_jimc3a9nez_salvador_oscar1.pdf

[12] https://www.abiinteriors.co.uk/biomimicry-in-design-7-incredible-buildings-inspired-by-nature/?gclid=Cj0KCQjwwfiaBhC7ARIsAGvcPe4pyANVChM51bKxAuxIoIAN3HSohxzu2nzUCDgBh3mCT7EcM_WKutgaAqDJEALw_wcB

[13] https://academic.oup.com/jcde/article/7/1/1/5809434

[14] Showkatbakhsh, Milad (2021). Homeostatic Urban Morphologies: An Evolutionary Model to Generate Urban Morphologies With Embedded Homeostatic Behaviours. PhD thesis The Open University

[15] Derrible, S., Cheah, L., Arora, M., Yeow, L.W. (2021). Urban Metabolism. In: Shi, W., Goodchild, M.F., Batty, M., Kwan, MP., Zhang, A. (eds) Urban Informatics. The Urban Book Series. Springer, Singapore

[16] Pincetl S, Bunje P, Holmes T (2012) An expanded urban metabolism method: toward a systems approach for assessing urban energy processes and causes. Landscape Urban Plann 107(3):193–202

[17] Geddes P (1915) Cities in evolution: an introduction to the town planning movement and to the study of civics. Williams and Norgate, London, UK

[18] Fischer-Kowalski, M. (1998). Society’s metabolism the intellectual history of materials flow analysis, part I, I 860- I 970. Journal of Industrial Ecology, 2(1), 61-78

[19] Otero Peña, D., Perrotti, D. and Mohareb, E., 2022. Advancing urban metabolism studies through GIS data: Resource flows, open space networks, and vulnerable communities in Mexico City. Journal of Industrial Ecology

[20] https://www.merriam-webster.com/dictionary/symbiosis

[21] https://ec.europa.eu/environment/ecoap/news/urban-symbiosis-recommendations-cities-re-use-resources_en#:~:text=%27Urban%20symbiosis%27%20aims%20to%20break,or%20water%20from%20industrial%20processes

[22] Batty, M., 2021. Introduction to Urban Science. In Urban Informatics (pp. 11-14). Springer, Singapore

[23] https://www.mckinsey.com/capabilities/operations/our-insights/smart-cities-digital-solutions-for-a-more-livable-future

[24] http://docs.wixstatic.com/ugd/6f8ebd_73c72cceb6434248a56ed053ac6e7ac2.pdf

[25] https://www.businessinsider.com/wayfindr-maps-subway-stops-for-the-blind-2015-12?IR=T

[26] https://www.arup.com/perspectives/publications/research/section/playful-cities-toolkit-resources-for-reclaiming-play-in-cities

[27] Roe, J. and McCay, L., 2021. Restorative Cities: Urban design for mental health and wellbeing. Bloomsbury Publishing

The Value of GIS & Spatial Data Science in Achieving the Sustainable Development Goals

Source: Madeleine Alston, Alcis

Early on the United Nations recognised the need for geospatial information and related analysis to ensure that global sustainable development is promoted and also achieved.  Consequently, reference is made in several publications, including The Future We Want and the 2030 Agenda for Sustainable Development (paragraph 76), a resolution adopted by the UN General Assembly in 2015.  Jack Dangermond, president of esri, also addressed the United Nations’ High Level Political Forum on 7 July 2020 on sustainable development and the value GIS currently offers regarding Covid-19.

However, a longstanding issue for countries to meet the UN Sustainable Development Goals (SDGs) is the lack of access to relevant data and/or resources to collect data. As part of an ongoing response the UN partnered with Google and other organisations to assist on the subject – an initiative known as Data for Now.  Furthermore, esri has worked with the UN and member countries to establish FIS4SDGs (Federal Information System for the SDGs), a global network of SDG data hubs.  The intention is for this system to enable all nations and the UN to monitor and report progress towards the SDGs.  FIS4SDGs also featured at the UN World Geospatial Information Congress in 2018, with an exploration of how countries and agencies are formulating a vision for achieving the SDGs through federated SDG Data Hubs. 

Further to the previous discussion on geospatial science and the complexity of the SDGs, the following discussion provides a brief consideration of the GIS & spatial data science methodologies and international studies applied to achieve some of the 17 SDG goals:

SDG 1 – No Poverty

Included in Ireland’s SDG Data Hub is a StoryMap (Fig. 1) that was generated to focus on unemployment and poverty in Ireland over the last decade.  The study also considers Goal 8 (Decent Work and Economic Growth) in the analysis and illustrates changes in relation to unemployment and poverty over the last decade across Ireland and also at county level.

Figure 1: Unemployment rates in Dublin (©Ordnance Survey Ireland | Central Statistics Office)

Similarly, a StoryMap (Fig. 2) was developed for Palestine’s SDG Site, focusing on poverty in Palestine in 2017.  It highlighted the large percentage of poverty in the Gaza Strip (53%), compared to the much lower 13.9% in the West Bank.

Figure 2: Proportion of Population Living below poverty line in Palestine (© Esri, CGIAR, USGS, Garmin, FAO, METI/NASA, USGS)

Through the open data portal of the Philippines SDG data is also made available through the application of a GIS webmap (Fig. 3). Poverty levels can be visualised at provincial level between 2006-2015. This services allows for a quick overview of the distribution of patterns where poverty either worsened or improved.  Comparative statistics are included for each province and can be consulted by any individual/decision-maker with access to the internet.

Figure 3: 2006-2015 Poverty Incidence at Provincial Level (© Esri, HERE, Garmin, FAO, NOAA, USGS, Philippine Statistics Authority)

SDG 2 – Zero Hunger

The United Nations World Food Programme (WFP) generates a global map (Fig. 4) of the prevalence of undernourishment of a total population in 2017-2019. The WFP defines undernourishment as “the condition in which an individual’s habitual food consumption is insufficient to provide the amount of dietary energy required to maintain a normal, active, healthy life.. Further information is available in The State of Food Security and Nutrition in the World Report 2020.

Figure 4: World Hunger Map 2020 (Source: World Food Programme)

In addition to the pdf map above, the WFP also maintains a live “HungerMap” at a global scale (Fig. 5a), which now also includes statistics on Covid-19, provided by Johns Hopkins University. Furthermore, more detailed demographic and nutritional statistics can be studied at country level (Fig. 5b). The HungerMap is a global hunger monitoring system and was developed with the Mapbox open source mapping platform. It covers 94 countries, including lower and lower-middle income countries (as classified by the World Bank).

Figure 5a: WFP HungerMap (© Mapbox, OpenStreetMap & Johns Hopkins University)
Figure 5b: WFP HungerMap – United Republic of Tanzania (© Mapbox, OpenStreetMap & Johns Hopkins University)

GIS functionality also allows for the generation of “Emergency Dashboards” in an infographic-style map to provide an overview of the most essential statistics by country. Information is also acquired from various sources, including the World Health Organisation and UN High Commissioner for Refugees. Figure 6 presents an example of the August 2020 map for the Democratic Republic of Congo, reflecting a variety of demographic and humanitarian statistics. The QR code in the bottom right provides access to a country brief and various other publications on the specific country.

Figure 6: WFP Emergency Dashboard for the Democratic Republic of Congo (Source: World Food Programme)

SDG 3 – Good Health and Wellbeing

Considering SDG 3, Covid-19 is the predominant subject globally of course and a number of web maps and related dashboards are available to consult online. The best example would be the Johns Hopkins University Covid-19 Dashboard. Apart from these toolkits, a number of GIS StoryMaps are also available on the subject and Figure 7 provides a snapshot of a Covid-19 StoryMap produced by staff members at esri. It provides additional information on the pandemic and also trends within the pandemic. These trends were obtained from a map that analyzes daily updates to the Johns Hopkins data.

Figure 7: StoryMap – Covid-19: The First Global Pandemic of the Information Age (Produced by Este Geraghty, Chief Medical Officer, Esri, and Charlie Frye, Chief Cartographer, Esri) © esri, Garmin

SDG 6 – Clean Water and Sanitation

Focusing on achieving SDG 6, MUN Impact and the Thirst Project partnered to develop an extensive StoryMap to educate and inform the public of the global water crisis and raise awareness of related issues. Data is obtained from the WHO/UNICEF Joint Monitoring Programme (JMP). Figure 8 shows one of the maps applied, which also offers downloadable data in chart and table format.

Figure 8: SDG Data Tracker (Source: WHO, UNICEF Joint Monitoring Programme for Water Supply, Sanitation and Hygiene (JMP))

SDG 7 – Affordable and Clean Energy

The UN emphasized that investment in solar, wind and thermal power, improving energy productivity, and ensuring energy for everyone is vital for the achievement of SDG 7 by 2030.

As part of esri’s ‘ArcGIS Solutions for Local Government‘ the Calculate Solar Radiation configuration for ArcGIS Pro was developed to assist in calculating solar radiation maps to assess whether buildings have potential for solar panel installation. Figure 9 shows a snapshot of a web scene that illustrates the application.

Figure 9: Calculate Solar Radiation (© esri, NASA, NGA, USGS, FEMA | Esri Community Maps Contributors, City of Naperville, County of DuPage, BuildingFootprintUSA, Esri, HERE, Garmin, SafeGraph, INCREMENT P, METI/NASA, USGS, EPA, NPS, US Census Bureau, USDA | Source: USGS, NGA, NASA, CGIAR, GEBCO,N Robinson, NCEAS, NLS, OS, NMA, Geodatastyrelsen and the GIS User Community)

In 2019, a partnership between USAID and the National Renewable Energy Laboratory was established and a Renewable Energy GIS Tool Guide was produced. The report was effectively a comparative analysis of the following six web GIS applications and includes a qualitative analysis of functionality and capability and an overview of quantifiable attributes related to each tool/application:

Global Solar Atlas

Global Wind Atlas

Multi-Criteria Analysis for Planning Renewable Energy (MapRE)

European Commission Photovoltaic Geographical Information System (PVGIS)

International Renewable Energy Agency (IRENA) Global Atlas

Renewable Energy Data Explorer (RE Explorer)

Figure 10: Global Wind Atlas (© 2019 DTU | Powered by WAsP)

SDG 11 – Sustainable Cities and Communities

More than half of the world’s population lives in cities and the UN projection indicates that two-thirds of all humanity will be urban by 2050 (UNDP). It has also been said numerous times that the battle against climate change will be won or lost in the cities. Thus, significant transformation in the development and management of urban space is essential to achieve sustainability. The UN’s 2018 SDG 11 Synthesis Report provides an overview of progress made to date, regarding goal 11.

One of the most significant tools recently developed is the Million Neighborhoods Map by the Mansueto Institute for Urban Innovation at the University of Chicago. The map highlights informal settlements globally and assists in identifying communities needing infrastructure, resources and sanitation most.

Figure 11: Million Neighborhoods Map (© University of Chicago, Openstreetmap, Mapbox)

Prof. Luis Bettencourt (Inaugural Director of the Mansueto Institute of Urban Innovation) stated: “The projected growth of informal settlements, in combination with the challenges of climate change, requires the world’s immediate attention. We hope the Million Neighborhoods Map will create a change in perspective and methods enabling new forms of community-driven urban planning…” “Using this map, we can quickly identify the infrastructure deficits of entire cities and pinpoint areas most in need of improvements.”

SDG 13 – Climate Action

The United Arab Emirates Ministry of Climate Change and Environment developed a National Climate Change Adaptation Program and related targets and strategies (Figure 12) to achieve SDG 13. 

Figure 12: UAE Approach for Climate Action (Source: United Arab Emirates Ministry of Climate Change and Environment)

The UAE Ministry of Climate Change and Environment also provides an Open Data service via the ministry’s information center. In addition, the GIS outlined in Figure 13 below has been constructed and is accompanied by the “GeoEnvAe” mobile application, providing spatial information such as environmental, biodiversity, protected areas and agricultural statistics across the UAE.

Figure 13: UAE Ministry of Climate Change and Environment Smart GIS (Source: UAE MOCCAE)

In the US, a partnership was formed between the Desert Research Institute, University of Idaho and Google to develop a service called Climate Engine (utilising Google Earth Engine).  This application allows for the analysis of climate and earth observations in relation to drought, water usage, agriculture, wildfire and ecology. Figure 14 shows the wildfire ‘Burning Index’ for the country.

Figure 14: Climate Engine Burning Index (Powered by Google Earth Engine | Licensed: cc)

SDG 14 – Life Below Water

Some of the main targets of SDG 14 are to reduce marine pollution, protect and restore ecosystems, reduce ocean acidification, ensure sustainable fishing and the conservation of coastal and marine areas.

The UNEP and WCMC (UN Environment World Conservation Monitoring Centre) Ocean Data Viewer offers users the ability to view and download various spatial datasets regarding marine and coastal biodiversity.

Figure 15: Ocean Data Viewer (© 2018 United Nations Environment Programme, WCMC, Leaflet)

Another very interesting application of web mapping is the Plastic Adrift site where users can choose a location in the ocean on a global map to see the potential movement of marine plastics over time (Figure 16).

Figure 16: Plastic Adrift (Produced by Erik van Sebille, David Fuchs and Jack Murray | Licensed: cc)

The scientific methodology applied to calculate the paths of floating debris over a 10 year period is complex and the video below provides a better further information. Further information on the tool can be found in this paper.

SDG 15 – Life on Land

“Forests cover 30 percent of the Earth’s surface, provide vital habitats for millions of species, and important sources for clean air and water, as well as being crucial for combating climate change. Every year, 13 million hectares of forests are lost, while the persistent degradation of drylands has led to the desertification of 3.6 billion hectares, disproportionately affecting poor communities.

While 15 percent of land is protected, biodiversity is still at risk. Nearly 7,000 species of animals and plants have been illegally traded. Wildlife trafficking not only erodes biodiversity, but creates insecurity, fuels conflict, and feeds corruption.” UNDP

The Half-Earth StoryMap provides for the visualisation of biodiversity globally and features embedded web maps to investigate the spatial distribution of various plant and animal species. The Biodiversity web map provides a stand-alone tool (Figure 17) to search the globe for the distribution of various animal species. The Half-Earth Project is an initiative of the E.O. Wilson Biodiversity Foundation, in partnership with esri.

Figure 17: Half-Earth Map (© 2017-2020, E.O. Wilson Biodiversity Foundation, Inc. HALF-EARTH PROJECT and HALF-EARTH DAY are registered trademarks of the E.O. Wilson Biodiversity Foundation, Inc.

This post does not reflect a comprehensive study of the available geospatial toolkits and methodologies for the promotion of sustainable development and conservation of natural resources and biodiversity. Nonetheless, it provides a sample of important applications relevant to each of the discussed Sustainable Development Goals (SDGs) and highlights the importance of applying GIS and spatial data science to aid the task of achieving sustainability globally.

Resources

GIS for Sustainable Development

UN Global Geospatial Information Management

SDG Monitoring and Reporting Toolkit for UN Country Teams

SDG Country Profile

SDG Indicators and Data

Open SDG Data Hub

UN Environment SDG Hub

Migration Data Portal

The Impact of Digital Infrastructure on the SDGs

Utilizing geospatial information to implement SDGs and monitor their
Progress

Systems Thinking, Geospatial Science and the Complex Nature of the Sustainable Development Goals

Intellectual Property of mohammed

I sat in on a panel discussion at the AAG conference (Las Vegas, 2009) between the US State Department, Jack Dangermond from esri and a number of international organisations.  The subject was “Continuing Global Dialogues on Geospatial Science and Sustainable Development”.  Again, the aspiration for unified sustainable development goals was evident.  What was also clear was the level of complexity of such goals and the intricate role systems thinking and geospatial science would play in achieving them. 

The eight UN Millennium Development Goals were replaced 7 years later by 17 Sustainable Development Goals [1].  However, to date the achievement of these goals remains a challenge, whether it is due to systemic barriers [2] or issues around prioritisation and accountability [3].  In addition, I argue that a holistic view of and complex systems approach to these 17 goals are predominantly absent and contribute significantly to these deficiencies.  Considering the familiar image of the Sustainable Development Goals (Figure 1), it is hard not to envisage a list of subjects to be addressed through a reductionist approach:  decomposing these goals into 17 or more pieces, solving them separately and putting them back together as a consolidated solution. 

Figure 1: United Nations Sustainable Development Goals

However, such an approach ultimately overlooks the complex interrelated nature of these 17 goals – multiple causes and effects between them, feedback loops and autonomous actors.  A systems thinking approach would allow for the relationships between these goals to be identified and also prioritised in terms of importance.  Hence, the consideration of network theory (link analysis potentially) would optimise prioritisation. Furthermore, the influence related goals have on each other will reveal leverage points to guide attention and decision-making.  How would Goal 1 (No Poverty) be achieved without consideration of Goal 3 (Good Health and Well-being) or Goal 4 (Quality Education)[4]?  How do different goals compete?  How will ecological sustainability and inequality reduction potentially be influenced by the aspiration of a high level of economic growth?  These goals should thus be viewed in a different manner.  Figure 2 provides one of many examples, showing the relationship between goals and the level of significance [5].  Fu et al. (2019)[6] regarded sustainable development as a societal outcome, produced through the assurance of a balance between human development and environmental protection, and in doing so revealing that goal implementation is an optimisation process within a complex global system.  

Figure 2: SDG Network Analysis (Jeff Mohr  @kumupowered)

The application of Geospatial Science in studying complex geographical systems offers far more than merely the analysis and visualisation of static or even basic temporal geographic dynamics. Increasing convergence of spatial data science and methodologies for studying complex systems enhances the possibility of considering and understanding better the interrelated and non-linear dynamics of phenomena.  This is particularly important, given the eye-watering 169 targets set out for the 17 SDGs.  Advancement in techniques for the incorporation of GIS data into agent-based modelling and cellular automata toolkits resulted in a significant increase in spatially explicit modelling. 

Furthermore, the benefits of GIS and BIM (Building Information Modelling) integration extend far beyond the optimisation of sustainable designs, assurance of collaborative workflows and efficient life cycle management of infrastructure (promoting Goals 9 and 11).  Combining BIM and GIS not only optimises the assessment of urban energy performance in smart city planning [7] for example, but also aids sustainable management of the complex relationship between the built and natural environment.  The practice of GeoDesign applies systems thinking to the collaborative consideration of complex environmental dynamics and subsequent enhancement of sustainable design.  The IGC (International GeoDesign Collaboration) adopted the SDGs as a standard format for assessing the impacts of more than 2 000 scenario-based designs [8].  Hence, all IGC projects should indicate how efficiently design scenario outcomes would address the SDGs.

The intention of this discussion is to promote systems thinking in terms of the SDGs and the consideration of these goals and related targets as interrelated components of a complex system. Thus, a broad overview is provided of subjects for deliberation, rather than an in-depth study of each.

References

[1]  https://sdgs.un.org/

[2]  https://europa.eu/capacity4dev/articles/challenges-implementing-sustainable-development-goals-asia

[3]  https://borgenproject.org/three-challenges-of-the-sustainable-development-goals/

[4]  https://unsdg.un.org/blog/untangling-complexity-sustainable-development-goals-moldova

[5]  https://blog.kumu.io/a-toolkit-for-mapping-relationships-among-the-sustainable-development-goals-sdgs-a21b76d4dda0

[6]  https://academic.oup.com/nsr/article/6/3/386/5381567

[7]  https://www.sciencedirect.com/science/article/pii/S1877705817318167

[8]  https://www.igc-geodesign.org/project-workflow

Arup Foresight & the Future of the Built Environment

“Foresight work is mostly about anticipating how the world is changing and we use those anticipations to create alternative futures.  What are our assumptions of the future and based on those assumptions, what do we change?”

Sohail Inayatullah

UNESCO Chair in Futures Studies

As with many other systems, the complexity of the built environment results in constant change and emergence over time.  It is thus essential that methodologies are in place for identifying factors and trends that would ultimately shape the future of the built environment.  The practice of foresight encapsulates approaches, tools and skill sets to help individuals or organisations to explore, visualise and shape the future.

Arup Foresight consists of a multi-disciplinary team of consultants and designers that assists clients in future-proofing their businesses by understanding change and the opportunities that emergence may hold.  This team understands that key drivers of change exists and that there are implications of change, requiring a business or project to be future-proof.  Working across a broad range of sectors, Arup Foresight contextualises the impact of global trends and formulate decisions for the development of resilience for the future.  The key methodologies applied for future-proofing businesses or projects include horizon scanning, trend research, scenario planning and visioning.  Consequently, the Foresight team’s focus is formulated around four main subjects:

  • Strategy and Visioning: How designs, strategies and solutions could be made future-proof through co-creating visions that provide directional frameworks for organisations
  • Insights and Trends: How emerging risks and opportunities could be identified by scaling global sources for “new trends, insights and cutting-edge thinking”.
  • Scenario Planning: How preparation for an uncertain future can be more efficient, by “challenging our tendency to favour ‘business as usual’” through scenarios to help the framing of strategic thinking and options.
  • Design and Innovation: How new business models and solutions could be developed through a range of approaches – from digital transformation to product and system implementation

Horizon scanning provides for a search process for the identification of emerging issues and events, which may pose as opportunities or threats.  The UK Department for Environment, Food and Rural Affairs (DEFRA) defined Horizon Scanning in 2002 as “The systematic examination of potential threats, opportunities and likely future developments which are at the margins of current thinking and planning. Horizon scanning may explore novel and unexpected issues, as well as persistent problems or trends.”  See also: Urban Futures and the Complex Systems Approach

Foresight Tools & Platforms:

  • The Drivers of Change programme is a toolset for identifying and investigation a wide range of key global issues and trends driving change in the built environment – from climate change to urbanisation and poverty. These key topics can also be explored in a Drivers of Change app and through five “STEEP lenses” (social, technological, economic, environmental and political).
  • The Inspire insights database and platform comprises of more than 1 500 examples of emerging innovation and change to facilitate foresight and strategic thinking. Inspire is effectively an online tool for researching innovation across the built environment.

Further publications include the following:

Future of:

Cities Alive series:

Further publications on foresight, the future and related scenarios:


References

DEFRA (2002): Horizon Scanning & Futues Home. URL: https://webarchive.nationalarchives.gov.uk/20070506093923/http://horizonscanning.defra.gov.uk/


The Evolution of GIS

1832-new-map
Copyright:  Geocom Ltd.

While celebrating the 50th anniversary of Earth Day, it is virtually impossible not to consider the contribution of geographic information systems and science in studying and solving complex problems in Earth Sciences.  Given the fact that the first mention of a “geographic information system” occurred only 8 years before the first Earth Day celebration, in a paper by Roger Tomlinson, I decided to revisit the evolution of GIS over half a century.  The following is by no means a comprehensive discussion on the history of GIS, but rather a summary of what I personally deem as evolutionary highlights over time.

1960’s – The Field and a System

roger
Roger Tomlinson.  Copyright:  Esri Canada

  • As computers developed and the earliest concepts of quantitative and computational geography emerged, the field of geographic information systems (GIS) originated.
  • In 1963, Roger Tomlinson was commissioned by the Canadian government to create a natural resource inventory that can easily be managed. Tomlinson envisaged the use of computers to undertake this task and he designed an automated computing process that became the very first GIS, the Canada Geographic Information System (CGIS)
  • In 1964, Howard Fisher developed one of the first mapping software programmes (SYMAP, see p.2) at Northwestern University
  • In 1965, Fisher established the Harvard Laboratory for Computer Graphics, which not only created the first computer mapping software, but also became the first research centre for spatial analysis and visualisation.
  • In 1966, the Urban and Regional Information Systems Association (URISA) was established by a group of urban planning and information systems professionals and promotes various aspects of GIS to this day
  • In 1969, Jack and Laura Dangermond founded the consulting firm, Environmental Systems Research Institute, Inc. (Esri), which applied computer mapping and spatial analysis to assist land use planners to enhance decision-making

1970’s – Product Development

harvard
Harvard Laboratory for Computer Graphics and Spatial Analysis

  • In 1970, the US Census Bureau produced the first geocoded census by applying a topological model. The topological structure of street segments was coded with ID’s and addresses with X,Y coordinates
  • The Harvard Laboratory developed and distributed (in 1974) the POLYVRT program for the conversion of various data formats, using the topological model that was adopted by the US Geological Survey and Census Bureau
  • In 1977, this work secured a grant from the National Science Foundation and also a symposium for international research scholars, which resulted in the development of the ODYSSEY system (see p.7-8).

1980’s – Going Commercial

Arcinfo
ARC/INFO 3.4.2 (5 disks 3.5″)

  • With the enhancement in computing power, Esri improved software tools and the continuous undertaking of projects to solve real-world problems resulted in the development of robust GIS tools that could be applied more widely
  • Consequently, Esri gained recognition from academia regarding spatial analysis methodologies and the need for tools resulted in the development of the first commercial GIS product, ARC/INFO (ArcInfo)
  • In 1982, this product was released and Esri’s evolution into a software company was initiated
  • In 1984, Geographic Resources Analysis and Support System (GRASS GIS) was released as open source software suite
  • In 1986, development was undertaken of the first MapInfo desktop software
  • In 1987, the UK’s Economic and Social Research Council (ESRC) established four regional research laboratories for four main purposes: data management and provision of spatial data archive, software development, spatial analysis and research training and professional development
  • In the same year the Committee of Inquiry into the Handling of Geographic Information recommended that the British Ordnance Survey should transition to a full digital environment (Waters, 1998)

1990’s – Desktop GIS and a Science

giscience
Copyright:  Joe Dignam

  • Esri released the desktop solution Arcview throughout the 1990’s
  • Further development of the Internet and enhance computing power resulted in a widespread adoption of GIS
  • In 1992, Michael Goodchild made a major contribution to the field of GIS by stating in a publication that the discipline should transition from a systems to a science-orientated position (Goodchild, 1992)
  • Hence, focus should now shift from ‘how to get geographic information into the system’ to ‘how to handle and exploit this data held in the system’
  • Consequently, the discipline of GIScience was born and resulted in the enhancement of spatial data analysis and visualisation tools and techniques

  2000 – Desktop GIS, Open and Online Developments

open


  • In 2002, Gary Sherman started development of the open source Quantum GIS software, now known as QGIS
  • In 2004, OpenStreetMap was founded on the foundation of voluntary GIS, which gained momentum
  • In 2005, Google Maps and Google Earth were launched, providing interactive online mapping and a digital representation of the globe respectively
  • In 2007, Google launched Street View as web application and component of Google Maps and captured more than 10 million miles of imagery across 83 countries in the first 10 years
  • In 2009, Ordnance Survey data became freely available to the public

The last two decade have seen an immense development drive in the field of GIS and the integration of related processes, methodologies, techniques and toolkits.  From Building Information Modelling and Digital Twins to Smart City development and Urban Analytics.  As we embark on this journey to an ultimately digital world, the geographic information system and science will continue to play a substantial role.

smart-GIS1
Copyright:  Urbanizehub

Finally, I believe that the application and integration of GIS with toolkits for modelling dynamical systems (ABM and cellular automata) and generating virtual urban scapes (CityEngine & ArcGIS Urban with Unity or Unreal) will continue to play a pivotal role in sustainability and climate action (the theme of Earth Day 2020).

References:

Goodchild, Michael F. 1992. “Geographical Information Science.” International Journal of Geographical Information Systems, 6(1): 31–45.

Waters, Nigel. 1998. “Geographic Information Systems.” Encyclopedia of Library and Information Science, 63: 98–125.

1000 GIS Applications

StoryMap on Earth Challenge 2020

Digital Twin:  Amaravati

ArcGIS Urban

High-End 3D Visualisation with CityEngine, Unity and Unreal

GIS & Agent-based Modelling:  Urban Growth Model by Andrew Crooks

Enabling Smart Cities and Communities with GIS

John Conway and the Game of Life

john
Photo Credit:  Thane Plambeck – Wikipedia

“He is Archimedes, Mick Jagger, Salvador Dalí, and Richard Feynman, all rolled into one.”

(The Guardian, 23/07/2015)

As many would know, the PhD journey kicks off with a dive into a vast ocean of subjects and information and theories and ideas.  Although I knew from the start that my research would concern the subject of urban complexity with a focus on the city of Cape Town, I had no idea whether this would entail a study of a socio-economic dynamics or land-use change over time.  Consequently, I started off by investigating methodologies for studying complex systems:  agent-based modelling and cellular automata.  Three names frequented my voyage into cellular automata:  Michael Batty, Stephen Wolfram and John Conway.

John H. Conway was an English mathematician from Liverpool who spent three decades studying mathematics (incl. symmetry) at Cambridge University, before he moved to Princeton University and held the title of John von Neumann Professor Emeritus (Applied and Computational Mathematics) for more than a quarter of a century.  His induction saw him writing his name down in the book that contained the names of Isaac Newton, Albert Einstein and Alan Turing.  John Conway was widely praised as genius by prominent mathematicians and known to be constantly thinking about anything.  “Most mathematicians are analysts or group theorists or number theorists or logicians.  John has contributed to every single one of those areas…”. (Roberts, 2015)

Most notable works by John include On Numbers and Games, The Symmetries of Things and The Book of Numbers.  However, John Conway is perhaps most famous for the Game of Life.

The Game of Life

Although cellular automata’s origins can be traced back to the 1950s, extensive popular interest only developed after John Conway’s Game of Life cellular automaton was introduced in a 1970 Scientific American article (Gardner, 1970).  The Game of Life takes place in a two-dimensional grid in which cells can either be alive/ON or dead/OFF and is defined by a set of rules which jointly determine the state of a cell, given the state of its neighbours (Moore neighbourhood of radius 1).

Game-of-life_Pentomino
Intellectual Property of Eugene M. Izhikevich et al. (2015) Game of Life. Scholarpedia, 10(6):1816.

The rules are the following:

  1. Any ON cell with less than 2 ON neighbours at a certain time step changes to OFF at the next time step.
  2. Any ON cell with 2 or 3 ON neighbours remains ON at the next time step
  3. Any ON cell with more than 3 ON neighbours changes to OFF at the next time step
  4. Any OFF cell with exactly 3 ON neighbours change to ON at the next step

gameoflife

These rules were carefully chosen by Conway to satisfy the following criteria (Gardner, 1970; Game of Life):

  • “There should be no initial pattern [configuration] for which there is a simple proof that the population can grow without limit.
  • There should be initial patterns that apparently do grow without limit.
  • There should be simple initial patterns that grow and change over some time, before coming to end in three possible ways: fading away completely (from overcrowding or becoming too sparse); settling into a stable pattern that remains unchanged thereafter, or entering an oscillating phase in which they repeat an endless cycle of two or more periods.”

To Play the Game of Life

Although the Game of Life is quite simple, it provides great examples of the phenomena of self-organisation and emergence.  Both these concepts are important and applicable to a range of biological and non-biological systems.  The game was designed to explore ecological communities and evolution.  “Conway’s organization of rules reflects the epigenetic principle, that genetic action and developmental processes are inseparable dimensions of a single biological system, analogous to the integration processes in symbiopoiesis.” (Caballero et al., 2016)

The Game of Life was also chosen by Google for one of its ‘Easter eggs.  Type “Conway’s Game of Life” and notice the light blue cells in the top right corner, which will gradually crawl across the whole page.

In Memory of John Horton Conway (26/12/1937 – 11/04/2020)

References

Caballero, L., Hodge, B., Hernandez, S., 2016. Conway’s “Game of Life” and the Epigenetic Principle. Front. Cell. Infect. Microbiol. 6.

Gardner, M., 1970.  The fantastic combinations of John Conway’s new solitaire game ‘life’. Sci. Am. 223, 120–123.

Roberts, S., 2015. Genius At Play: The Curious Mind of John Horton Conway. Bloomsbury USA, New York.


The History of Complexity Science

5_1__complexhist
Copyright:  Jun Park

When considering the history of complexity science and related theory, it is difficult to bypass the wide-ranging narrative Melanie Mitchell (2009) provides on the subject.  Arguably, complex systems have been studied by humanity for thousands of years.  Mitchell (2009) traces this journey back to Aristotle (384-322 B.C.) and the emergence of Dynamical Systems Theory and how this influenced thinking and scientific discovery in the ages to come, until the sixteenth century and the contradicting studies of Galileo on motion.  Nonetheless, Mitchell (2009:17) points to Isaac Newton as the “most important person in the history of dynamics” and the inventor of the science of dynamics.  Based on Newtonian mechanics, Laplace proclaimed in 1814 that it is possible to predict anything.

However, the twentieth century saw the emergence of contradictory discoveries to this notion of absolute prediction, with an increasing understanding of chaos and chaotic systems and the concept of “sensitive dependence on initial conditions”.  However, the first experience of a chaotic system occurred in the late nineteenth century already, when the French mathematician Henri Poincare modelled weather behaviour.  This occurrence paved the way for the aspiration of predicting weather over a longer period and Edward Lorenz found in 1963 that even simpler computational weather models are subject to the sensitive dependence on initial conditions, with these systems manifesting nonlinearity.

From this theory of chaos emerged complexity theory and although complex systems were researched explicitly since the 1970’s (Vemuri, 1978), the studying of complex systems gained much traction with the establishment of the Santa Fe Institute, the first research institute dedicated to research of complex systems and especially complex adaptive systems.  The institute was founded by a group of 24 scientists and mathematicians, with a number of these individuals being scientists with Los Alamos National Laboratory.  In later years a number of other institutions were formed, dedicated to the study of complexity in systems which range from biological to social and economic systems.

I acknowledge that this discussion provides the briefest of overviews on the subject of complex systems and the Further Reading section presents a number of resources on the subject.  Furthermore, this map by Castellani (2018) provides a great visual overview of the development of the complexity sciences over a number of decades.

References

Castellani, B. (2018)  Map of the Complexity Sciences.  Art & Science Factory.  https://www.art-sciencefactory.com/complexity-map_feb09.html

Laplace, P. S. (1814). Essai Philosophique Sur Les Probabilites. Paris: Courcier.

Mitchell, M. (2009). Complexity: A Guided Tour. Oxford, U.K.: Oxford University Press.

Vemuri, V. (1978). Modeling of Complex Systems: An Introduction. New York: Academic Press.