Residential segregation was conceptualised by Massey and Denton (1988) as five distinct dimensions: evenness, exposure, clustering, centralisation and concentration. Reardon and O’Sullivan (2004) proposed an alternative to these dimensions, as they argued that spatial residential segregation consists of two primary conceptual dimensions: spatial exposure or spatial isolation and spatial evenness or spatial clustering.

Spatial exposure refers to how individuals of one group encounter individuals from another group or individuals of their own group (spatial isolation). Spatial evenness or clustering measure the degree to which different groups are distributed in a residential area. Reardon and O’Sullivan (2004) pointed out that the evenness and clustering dimensions are collated into a single dimension and that the exposure dimension remains unchanged, but now conceptualised as spatially explicit.
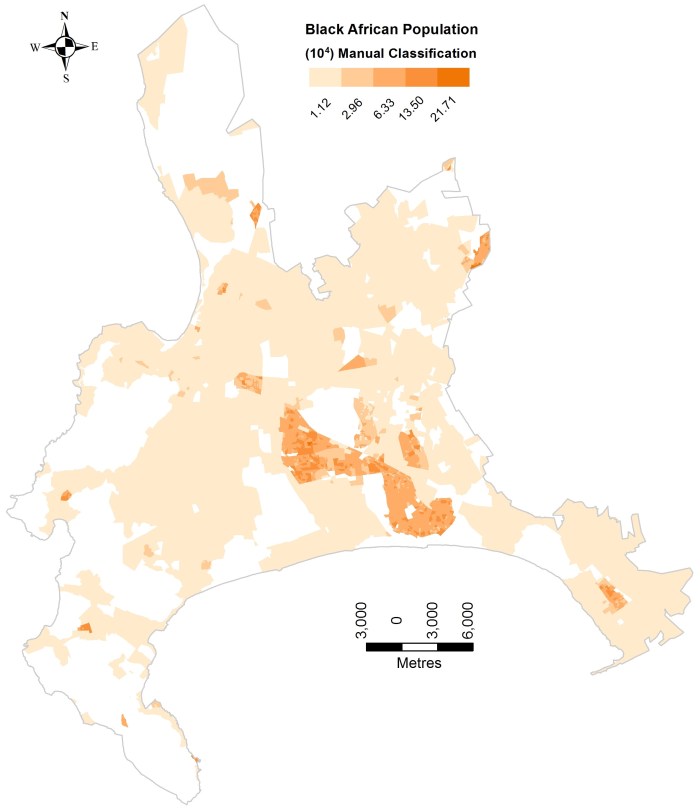
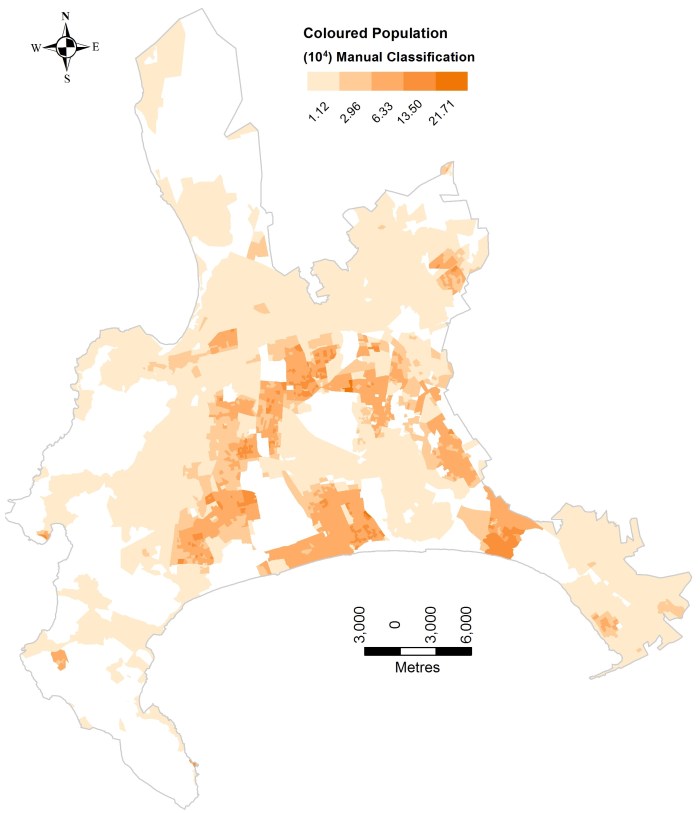
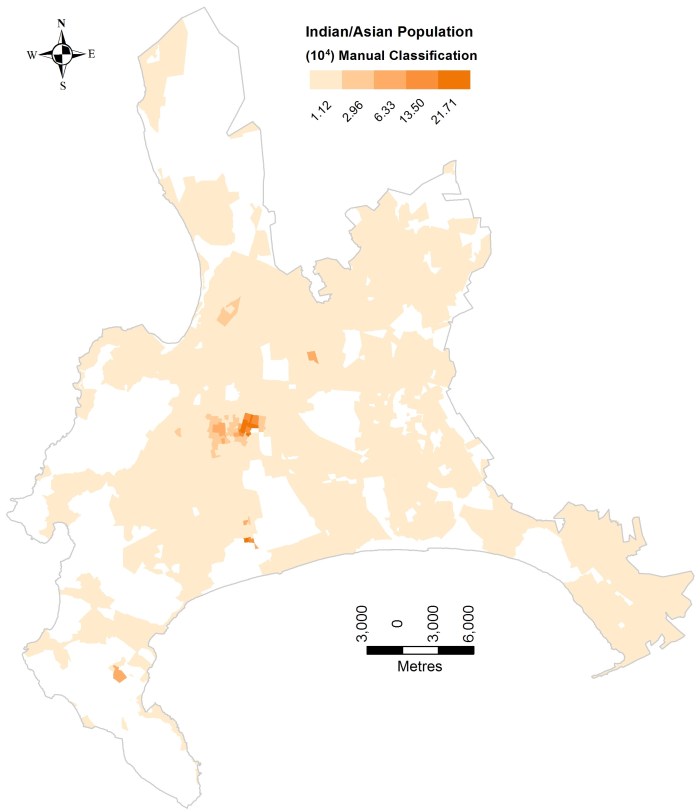
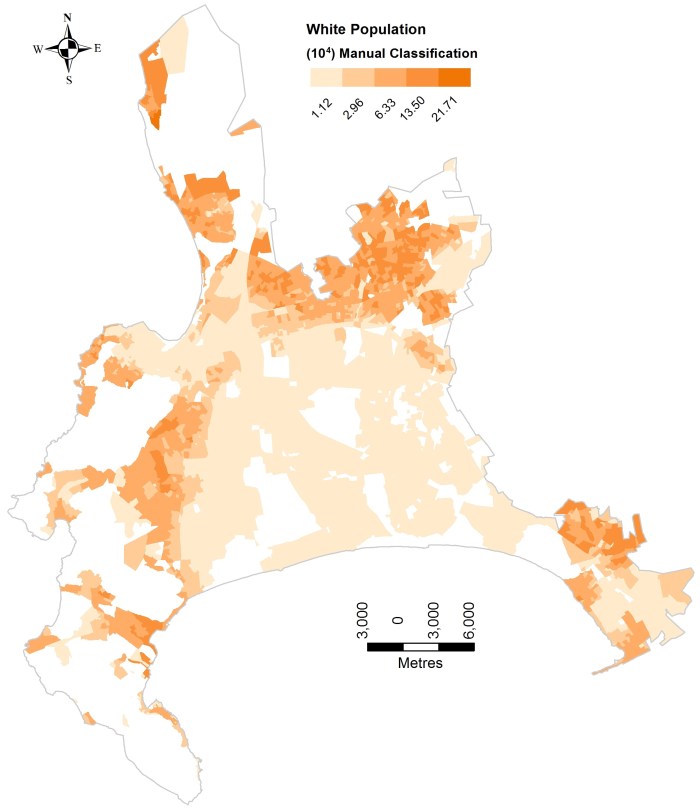
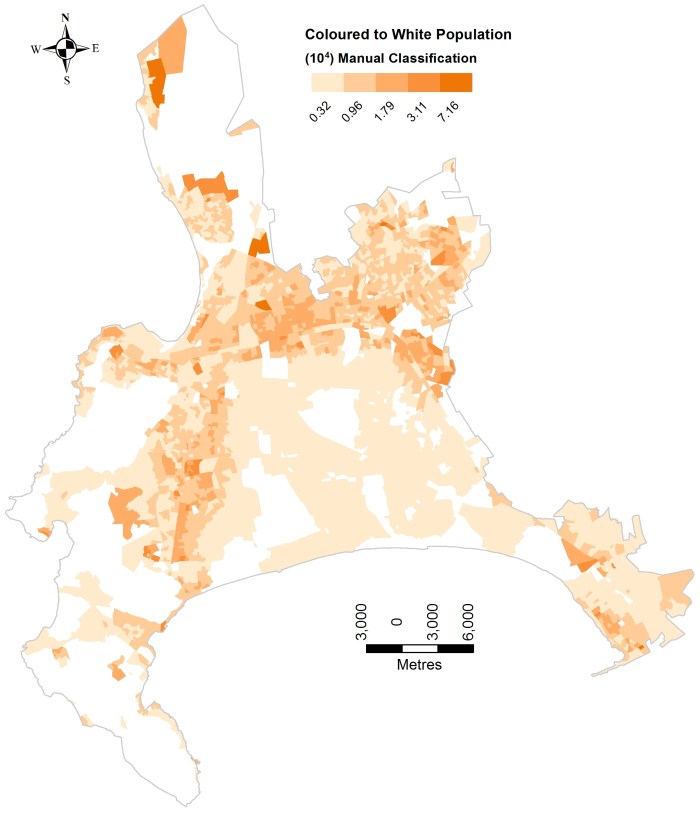
Feitosa et al. (2007) built on the dimensions of spatial segregation by Reardon and O’Sullivan (2004) and developed spatial indices (generalized spatial dissimilarity index, the spatial exposure index, the spatial isolation index and the spatial neighbourhood sorting index ) for each of them. The local spatial segregation indices were then applied to the study area of Cape Town and focus only on population group distribution of Black African, Coloured*, Indian/Asian and White residents.
Local Dissimilarity Index
The output of the local spatial dissimilarity index ranges from 0 to 1, with 0 indicating a minimum degree of evenness and 1 a maximum degree of evenness.

Local Spatial Isolation Index
The local spatial isolation indices of population groups are as follows and range again between 0 for minimum exposure and 1 for maximum exposure:
Local Spatial Exposure Index
The local spatial exposure index of population group m to n is as follows and ranges again between 0 for minimum exposure and 1 for maximum exposure (sample of two population groups):

Measurements were undertaken by the application of the QGIS plugin Segreg (developed by Sandro Sousa) to the Census 2011 (Small Area Layer) data for Cape Town, provided by Statistics South Africa. I had the privilege of providing input to the development process of this tool and found it most useful for the application of various other census indices for Cape Town.
* Coloured or Cape Coloured is the name given to an ethnic group in South Africa, composed primarily of individuals of mixed race.
***Please Note*** The boundaries of the study area and census tracts were adjusted to take into consideration ecological fallacy and the Modifiable Areal Unit Problem. A more detailed paper will follow soon.
Acknowledgement
I would like to thank Statistics South Africa for being of great assistance and always being willing to help with queries. I would like to acknowledge the work undertaken by Sandro Sousa and his patience with my comments and questions at various stages of development. Finally, I thank my fellow PhD researcher Marcus Saraiva for his advice and valuable input to this study.
References
Feitosa, F.F., Camara, G., Monteiro, A.M.V., Koschitzki, T., Silva, M.P., 2007. Global and local spatial indices of urban segregation. Int. J. Geogr. Inf. Sci. 21, 299–323.
Massey, D.S., Denton, N.A., 1988. The dimensions of residential segregation. Soc. Forces 67, 281–315.
Reardon, S.F., O’Sullivan, D., 2004. Measures of spatial segregation. Sociol. Methodol. 34, 121–162.
Statistics South Africa, 2012. Census 2011.
